Is this Mahler? This sounds like Mahler
 One of the most delightful parts of being a software engineer and hardware
tinkerer is having the ability to solve my own specific (and often niche)
problems. In this post, the particular problem I’ll be solving is the burning
need to know what is currently playing on WQXR, NYC’s classical radio station.
One of the most delightful parts of being a software engineer and hardware
tinkerer is having the ability to solve my own specific (and often niche)
problems. In this post, the particular problem I’ll be solving is the burning
need to know what is currently playing on WQXR, NYC’s classical radio station.
A typical Saturday for me looks like this: I wake up and make a coffee, bring it to the couch in the living room, pick up my knitting, and turn on the radio. Maybe midway through the morning a halfway-familiar piece comes on, but I’ve left my phone in the other room and won’t be able to go check the WQXR website without disentangling myself from my knitting and missing a bit of the piece that has captured my attention.
Or how about a weekday: I’m working on a project, elbows deep in the code, with the WQXR livestream open in one of my million browser tabs. I feel a glimmer of recognition, but I’m fully focused on my work and don’t want to break my concentration to go hunt down the livestream player and find out what it is.
To solve this particular problem, I needed two things: a way to find out what was on the radio, and a place to display it.
There are a couple of different ways you could find out what’s playing, including music identification services like Shazam. But those rely on already having a recording in their database to match against, and I’m listening to classical music where I could be hearing any one of dozens of different recordings (and even live performances) for any given piece, making it unlikely that such a service would be able to find a match. So I started with the source I was already using to get this information: the WQXR website.
If you leave the website open long enough, you’ll notice that it automatically updates to reflect what’s currently playing. This was great news for me, because it meant that somewhere in the page a script is periodically making ajax requests to get that information, requests that I could also make myself. To find out what these requests were, I eavesdropped on my browser’s network calls using the developer console.
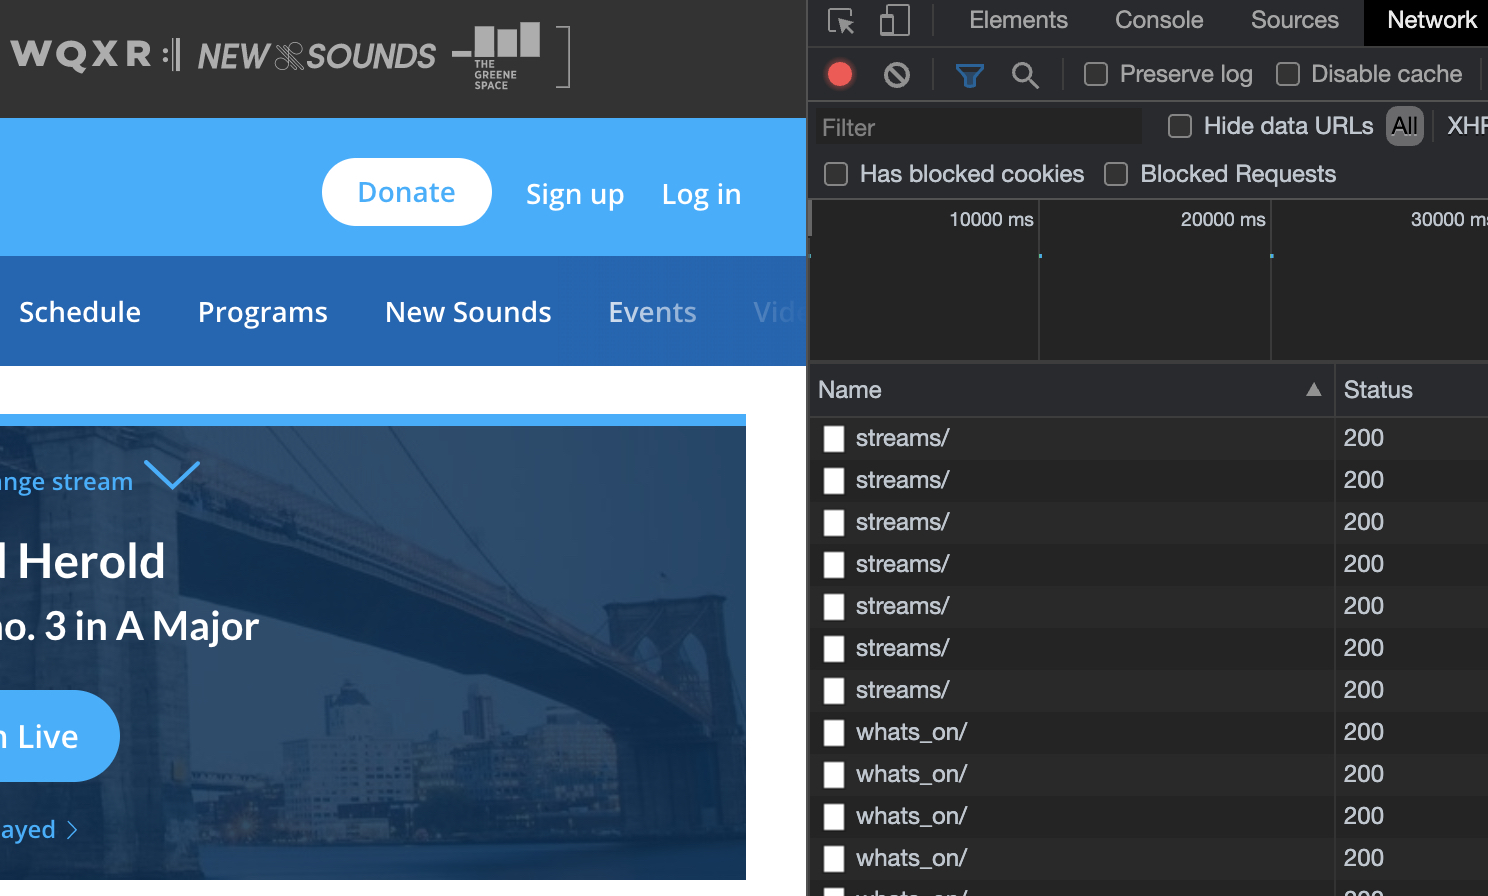
There are two calls being made here, one to an endpoint called streams,
and one to something very promisingly named whats_on. Making a request to
that second endpoint, we get a beautiful json response containing information
about what’s playing on New York Public Radio’s various livestreams. Great!
This is exactly what I need to satisfy the first piece of this project.
(I honestly can’t remember how I figured this out, but you can append the call letters for the particular station you’re interested in to the URI to just get information for that stream, but the full response would also have worked just fine.)
Okay, cool, so I have the data. How do I get this information in front of my eyeballs when I’m listening to the radio?
You already know from the teaser photo at the top of the post that I ultimately put it on my mantel, but I took an iterative approach to getting there.
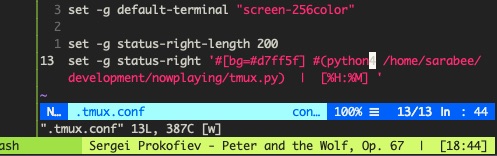
I use tmux to manage my terminal sessions, and it occurred to me that the
status bar, always there along the bottom of my terminal, might be a nice
place to have information about what’s currently playing. I wrote some
lightweight python classes for fetching and parsing the radio’s API response,
and a tiny script, tmux.py that outputs the information in the format I want for this
purpose.
Adding something to the tmux status bar is just a matter of adding a couple of
lines to .tmux.conf:
set -g status-right-length 200
set -g status-right '#[bg=#d7ff5f] #(python3
/home/sarabee/development/nowplaying/tmux.py)  |  [%H:%M] '
This overwrote the clock that was there by default, so I added one back in. By
default, scripts run in .tmux.conf are executed once every 15 seconds, which
was more than fast enough for my purpose. My status bar then looks like this:
This fixed the problem of not wanting to leave my terminal to find out what I’m listening to, but what about when I’m in the living room? I knew I wanted a display, that I wanted it to update automatically, like the tmux status bar, that I wanted it to be constantly running, like an indoor thermometer readout, and that I wanted it to be readable from any position in the room, with good view angles and readability under a variety of lighting conditions. This all sounded to me like the perfect excuse to work with e-paper.
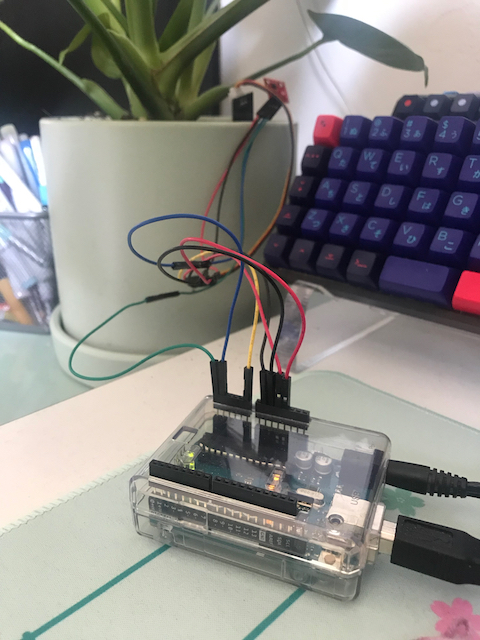
Pimoroni was having a sale, so I picked up two e-ink displays: the smaller inkypHAT, and the larger inkywHAT. I also got a couple of Raspberry Pi Zero Ws to pop them on top of (quick aside: these things cost $10 and have wifi and bluetooth, wowww).
Starting with the inkypHAT and the code I’d already written for handling radio data, I prototyped my idea, creating a tiny display that sits on top of my monitor. I set the Pi Zeroes up the way I set up my larger Raspberry Pi 3, with Raspbian Lite. Without worrying too much about styling the display aesthetically, I learned how to work with the Inky and Pillow libraries and wrote a script to get the composer and title chopped up to fit across multiple lines on the screen:
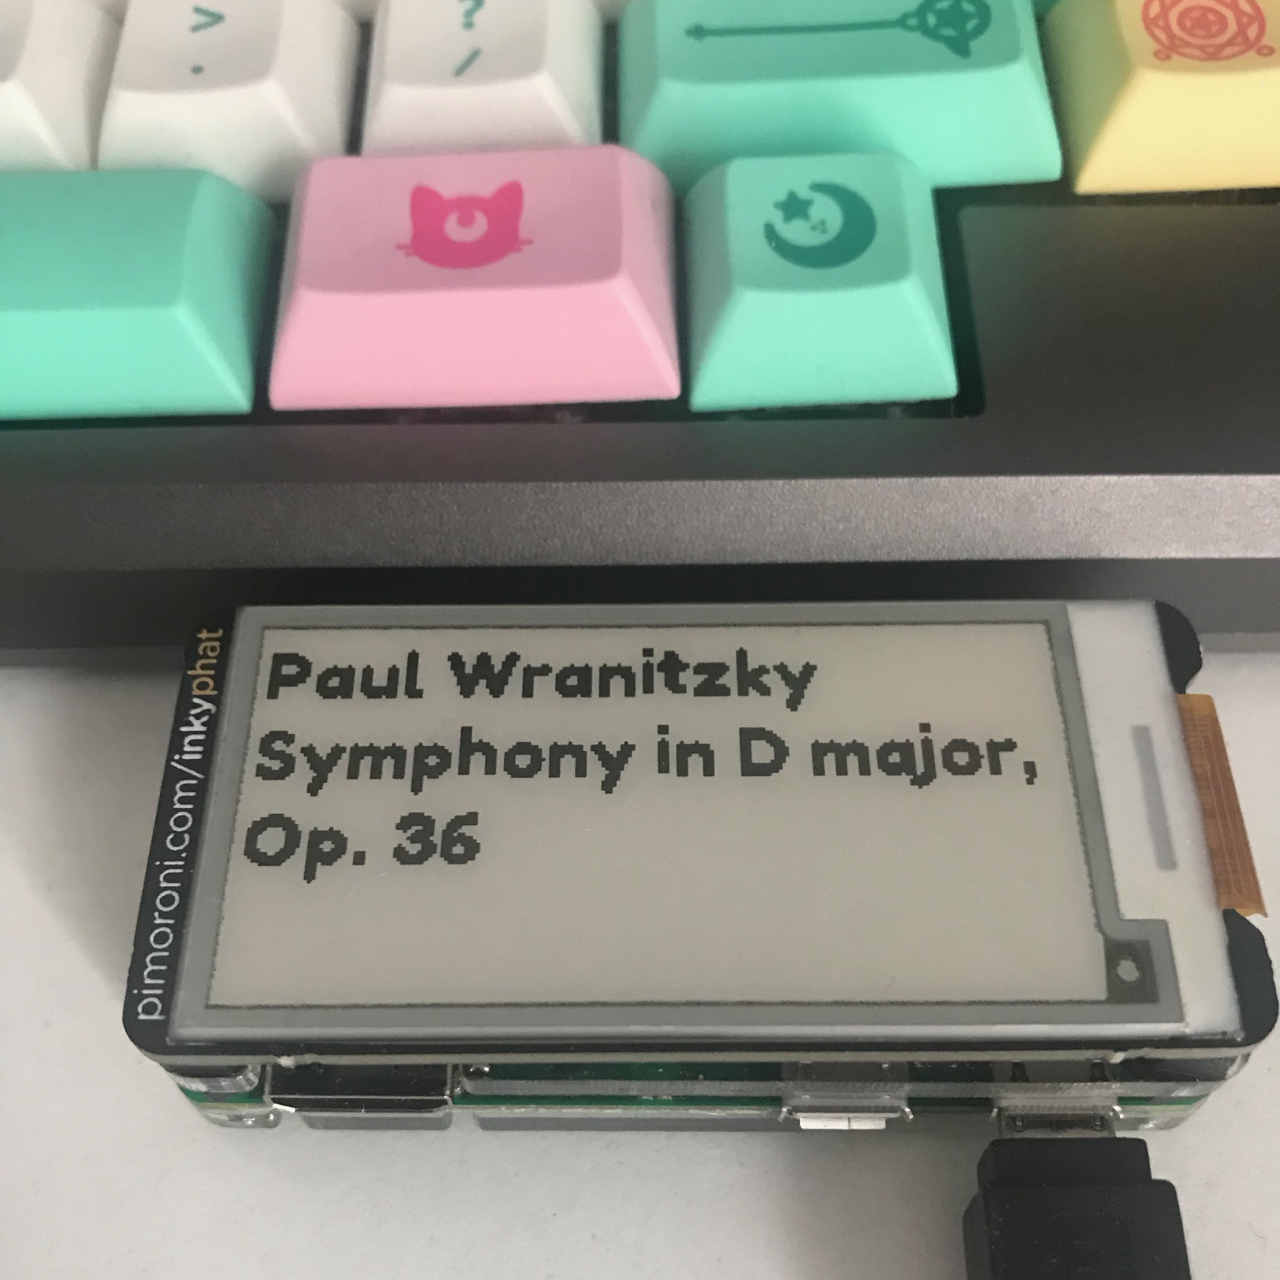
I have it running once a minute on a cron, and to avoid refreshing the e-ink display unnecessarily, I keep the last piece written to the display in memory and update only if I’ve gotten something new back from WQXR.
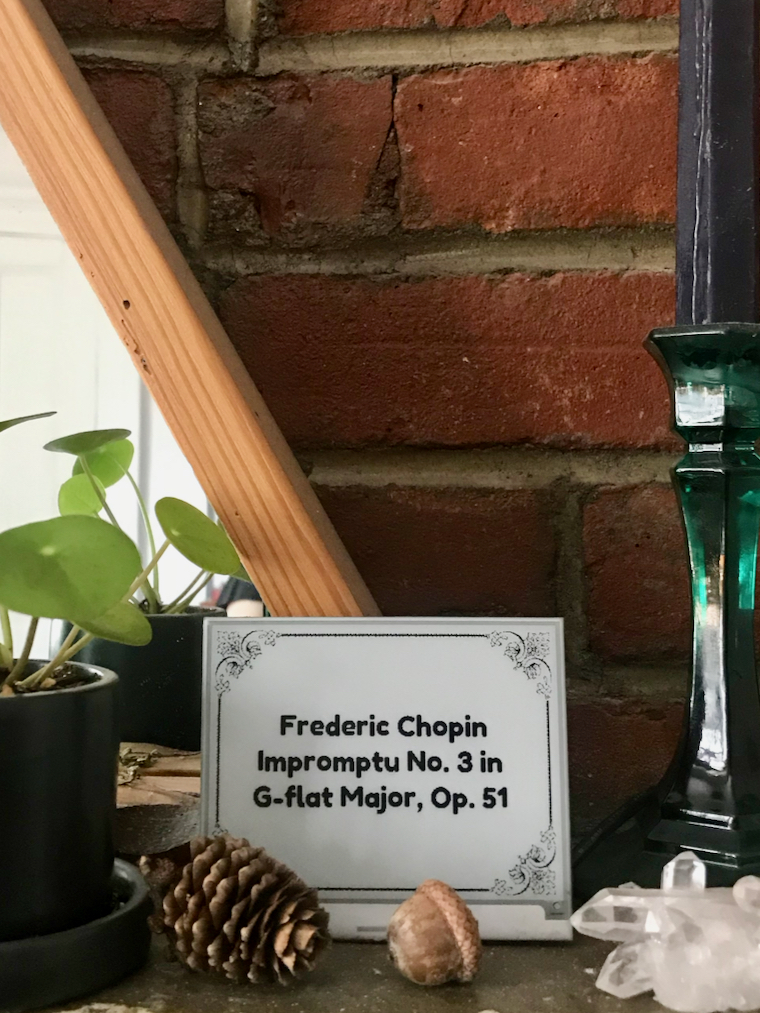
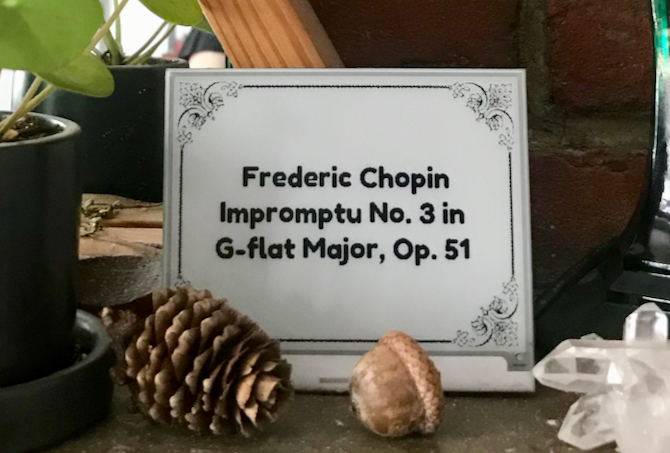
Reworking this script for the larger inkywHAT display wasn’t difficult; it mostly involved tweaking font size to take advantage of the larger screen. But since this is meant to live on my mantel and be highly visible in my living room, I wanted to make it look a bit nicer than just throwing the text on there. I found a clip-art scrollwork frame, and using only the MacOS Preview app and ImageMagick, got it into the right size and format for the e-ink display.
In Preview, I grabbed a corner of the frame and pasted it in again three more times, rotated 90 degrees each time, and carefully bumped each corner around until they were lined up and could be scaled down reasonably to the right dimensions (400x300px). Even though the image appeared to be entirely black and white, a closer look shows this wasn’t true at all! It’s actually full of many different shades of gray:

To get the image into the right format and flatten it down to just two colors, I used the ImageMagick command-line tools. While this extremely thorough page in the IM docs goes pretty far in-depth with the various ways you can convert an image to black and white, I ultimately ended up going with:
magick input.png -colorspace gray -colors 2 -normalize PNG8:output.pngWhich produces a frame that looks like this:

It’s a little rough when you see it on a relatively high resolution monitor, but looks great on the 400x300 e-ink display! After that, adding the text was pretty straightforward; earlier when only displaying text, I was still actually using Pillow to create an empty image in the correct dimensions that I drew the text onto:
img = Image.new("P", (inky_display.WIDTH, inky_display.HEIGHT))To use the frame, I simply started with the frame image instead:
img = Image.open(os.path.join(current_dir,
"whatnow.png")).resize(inky_display.resolution)
The last little bit of clean-up work involved getting the text centered in the frame, and setting the margins in my script so that the line breaks were a comfortable distance from its edges.
I’m happy with where this project is at; the text is clear and legible from anywhere in my living room, and my Saturday morning listening experience has been greatly improved. Eventually, it’ll get custom wooden housing, which will be its own post, I’m sure! Feel free to dig around in the project’s repo on GitHub to get an even better idea of how this all works.
 This post is a follow-up to the
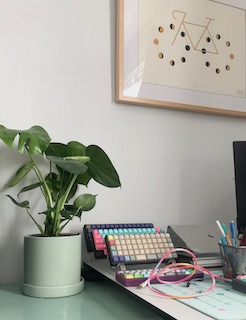 This past week my monstera deliciosa, a lovely tropical houseplant,
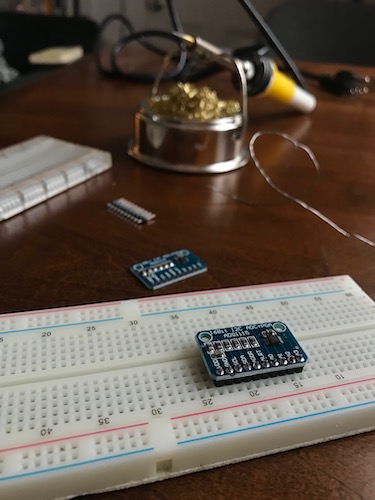 My first thought was to use a small, inexpensive component in between the two
called an ADC - analog-to-digital converter - which would convert the sensor’s
signal into something that my rpi could use. I bought two of these when
I bought my sensor, and got as far as soldering header pins on them so that
I could seat them on a breadboard before realising that they were both
duds. Bummer!
My first thought was to use a small, inexpensive component in between the two
called an ADC - analog-to-digital converter - which would convert the sensor’s
signal into something that my rpi could use. I bought two of these when
I bought my sensor, and got as far as soldering header pins on them so that
I could seat them on a breadboard before realising that they were both
duds. Bummer!